
Simpson’s Paradox
When I first learned about Simpson’s paradox, the definition was straightforward–the conditional odds ratio (OR) is reversed from the marginal odds ratio. What was puzzling to me was how to know whether or not to include the covariate in the model. Surely, it couldn’t always be correct to include the covariate? It turns out causal inference is the key to determining whether or not to include the covariate, or conversely how to determine if the data is consistent with the hypothesized causal model; this is especially important for observational studies.
This intent of this post is to illustrate there is more to understanding and untangling Simpson’s paradox beyond what is often covered in an intro stats course (especially if that course is focused on designed experiments vs. observational studies). Two great references for a thorough introduction to causal inference are Chapters 5 & 6 of McElreath’s”, Statistical Rethinking, and Pearl, et al’s Causal Inference in Statistics: A Primer.
Include the Covariate
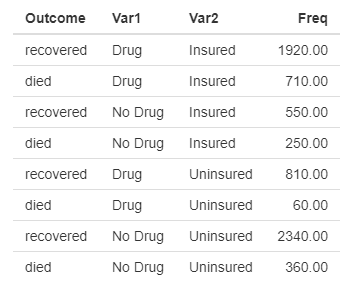
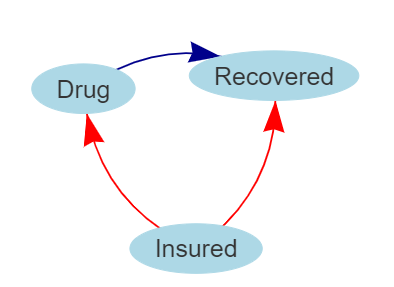
Consider a study where a drug is being evaulated to see if improves a patient’s odds of recovery. The table below has information about patient outcome, whether or not the patient was administered the drug, and whether or not the patient had health insurance. The question is whether or not we should include the covariate for insurance in the model. The diagram on the right is a causal diagram that reflects a belief about the relationships between the outcome and the two covariates:
- Insurance status affects whether or not the patient receives the drug (e.g., the drug is very expensive so doctors are less likely to prescribe the drug to uninsured patients).
- Insurance status affects likelihood of recovery (e.g., patients with health insurance tend to have fewer co-morbidities and have better baseline health status than uninsured patients).
The marginal and conditional odds ratios are shown in the table below.
| OR | Lower 95% | Upper 95% | |
|---|---|---|---|
| Marginal | 0.75 | 0.66 | 0.84 |
| Insured | 1.23 | 1.03 | 1.46 |
| Not Insured | 2.08 | 1.56 | 2.76 |
This data clearly exhibits Simpson’s Paradox. If we failed to include insurance status, we would conclude that the drug has a negative impact on odds of recovery (OR < 1). We might turn to intuition in this simple case and realize this makes no sense since the odds of recovery improve for both the insured and uninsured groups. The causal diagram confirms our intuition. Insurance status is what Pearl calls a confounder, and in this particular model failing to condition on the confounder opens a “back door” from drug to recovery. Failing to close the “back door” will result in the wrong conclusion. Thus, the conditional odds ratios are correct and the drug has a positive effect on recovery.
Do Not Include the Covariate
Now consider the table below where the only change is instead of insurance status the second covariate is whether or not the patient’s hospital bill was paid in full. The numbers in the table are identical. Since payment status is a post-treatment variable, this is reflected in the causal diagram where now the arrows in red are reversed.
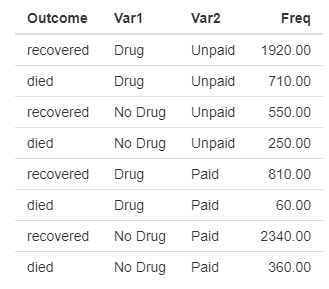
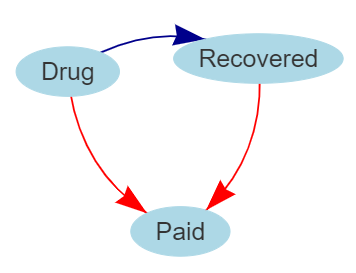
Clearly the marginal and conditional ORs are identical to the previous example. Does this mean the conditional ORs are correct here too? The answer is no. Whether or not the hospital bill is paid happens after treatment, so intuitively it can’t affect the doctor’s decision whether or not to prescribe the drug. In this case the covariate in question is what Pearl calls a collider. If we condition on the collider, then we open the backdoor from drug to recovery and we will draw the wrong conclusion. In this case the marginal OR is correct–the drug reduces the odds of recovery.
Summary
The key takeaway for me after learning about causal inference is that the data alone (i.e., the tables) are not sufficient to determine whether it is or is not appropriate to include a covariate. A causal model of the hypothesized relationships is required. Once a causal model is defined, then there are rules for determining whether or not to condition on a given covariate. While the two examples above are simple enough to fall back on intuition, it is easy to imagine once there are multiple covariates with complex relationships between them that intuition quickly breaks down. Fortunately, causal diagrams provide a systematic way forward even when our intution fails!